
Strategy but for Agencies: Mapping Agencyland
How can we visualise the varieties of agencies in the industry? And why does one particular group enjoy advantages the others lack?

My last post was very wordy. I mean, I love this stuff, so I get carried away. I could talk for hours. But let’s take some of those words and thoughts and translate them into a visual format that can convey the information differently. Not necessarily better, just differently.
A useful approach in strategy is framing information in different ways to see what we can learn from it. It’s important to remember that every framing excludes some information. In The Origins of Obviousness, I talked about horizons of disclosure. The key point is that for data to be useful, we have to organise it1, but our choices in how to organise data necessarily exclude other ways of organising it. And so they exclude the things we could learn from organising it those different ways. (Every revealing is also a concealing, says Heidegger.)
In the last article, examining the marketing agency industry, I’ve already made some choices which have excluded other possibilities. I listed three key dimensions on which agencies differ from each other – how narrow or broad their service offering is (specialising versus integrating), how large they are (mainly in headcount) and whether they’re a local independent or part of a global network.
In focusing on those things, I’ve excluded all kinds of other potentially relevant dimensions along which agencies may differ from one another. Any one of them could provide insights into how an agency could develop a strategy for deriving more profit from the difficult industry landscape. And I will look at them – later.
So why haven’t I jumped straight to trying to find radical new ways of framing things?
Well, there are a few reasons, and they’re general reasons that apply to most strategic processes.
Firstly, in most kinds of strategy, the majority of strategic issues can be resolved largely through clarity. That is, putting some clear thinking and structure around the obvious (most accessible) worldview or framing of the situation. Sure, the big sexy case studies of radically rethinking situations get talked about the most. Walmart reframed what constitutes a city. Ikea turned the outsourcing of assembly to their own customers into a point of difference. Very clever, very exciting.
In line with my articles about creativity and effectiveness, it is true that great strategies come from non-obvious frames of reference. And there is a lot of literature and thought leadership around ways of doing this – Blue Ocean strategy, market shaping, open innovation, etc. But I think that popular emphasis on these most interesting strategies and ideas distracts many managers and strategists from simply doing a very good job of applying structured thinking and time-tested models for organisational success.
Secondly, I think that establishing a clear picture of the obvious frames of reference is a very useful precursor to radically rethinking those frames of reference. Get a clear picture of the way things seem to be, and then start playing with it – question assumptions, carve the challenge up in different ways, etc. And that is what I will do with this series of articles, as I start with the obvious ways agencies can improve profits and then move into increasingly non-obvious ways.
And finally, when doing strategy, at some point you’re going to have to explain it to someone. And your audience for that explanation will probably be very immersed in the obvious frames of reference – as experienced experts typically are. To explain your strategy to them, you’ll need to take them on a simplified version of the same journey you take to arrive at it. So start where they are: with clarifying the obvious.
Mapping out two dimensions is easy. A simple chart has two axes, and we’ve got two dimensions (variables) which vary between two extremes each.
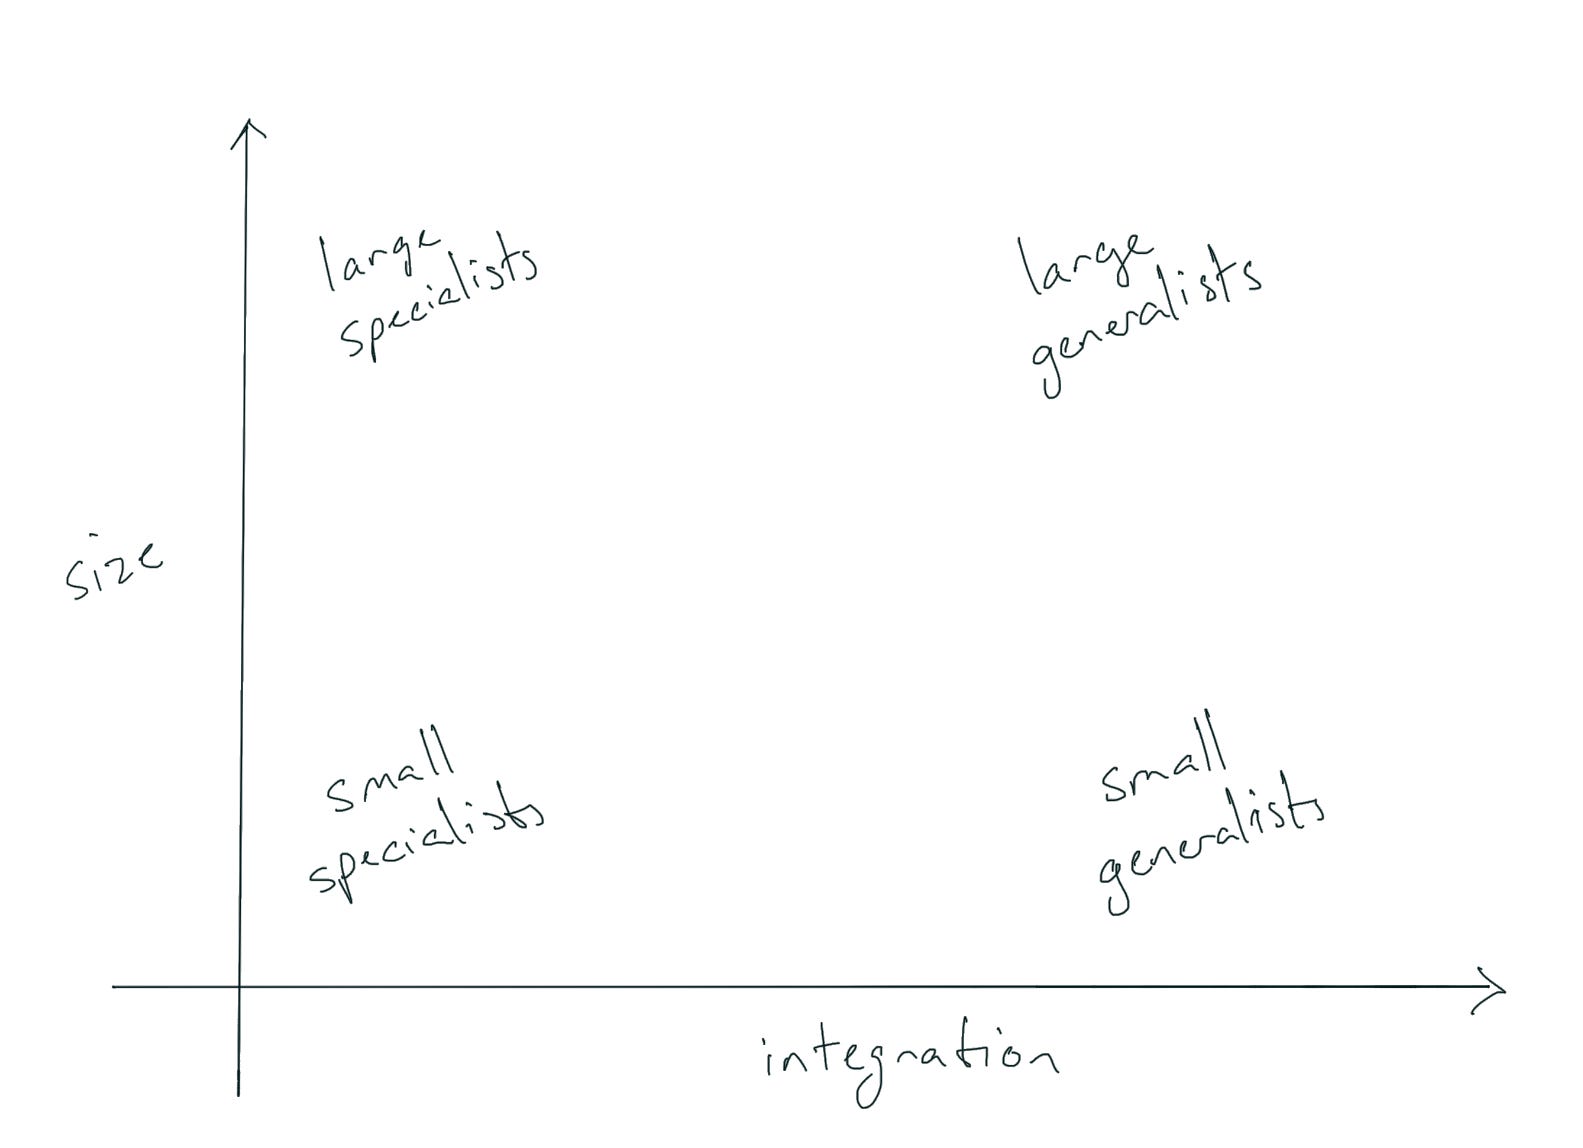
If our variables had discrete categories rather than changing along a continuum, we would use a matrix rather than a chart. If there were only two categories for each of the two variables, it would be a simple 2x2 matrix – four boxes of the four possible combinations.
Let’s map an imaginary (but based in reality) market of agencies along these dimensions.
Each dot represents an agency. (Ignore the little differences in dot sizes – I used an inky kind of app to draw this.)
Size clearly varies along a continuum – an agency employing 20 people should be slightly higher on the map than an agency with 19 people. But integration doesn’t vary quite so continuously. Some agencies are more integrated than others, but there are lots of specialists at the extreme left-hand side of the “integration” dimension. All of them are equally “specialist”, but to keep them from unhelpfully overlapping, I put some to the left and right of others. That could be confusing, so let’s make the x-axis show categories rather than a continuous variable.
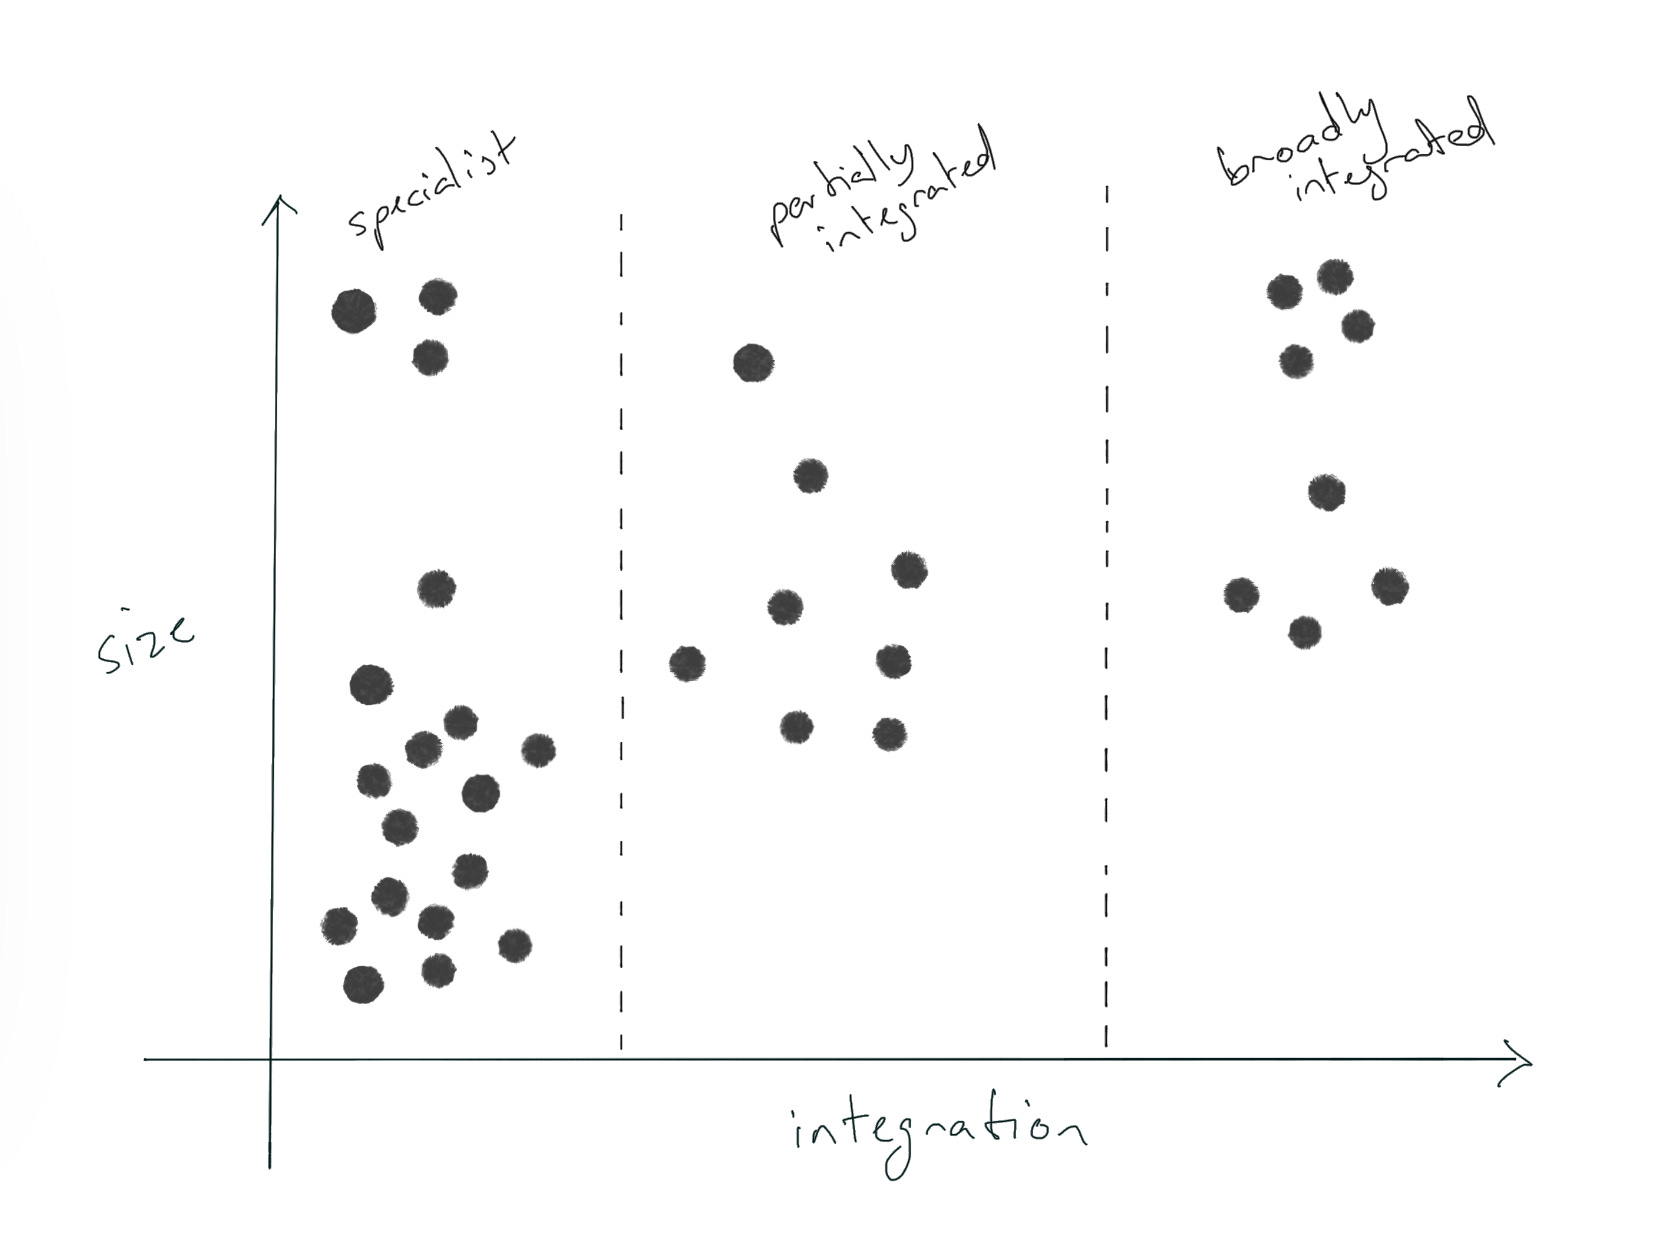
For our purposes, this is accurate enough to make some observations. The left-hand column are specialist agencies of varying sizes. In the middle, agencies which offer more than one type of service – for example, a creative agency with its own video production team. And the right-hand column includes agencies with the broadest range of services.
Note that I have avoided describing this column as “100% integrated”, mainly because that’s extremely rare and for the purposes of competitive mapping, the drivers and challenges for profitability wouldn’t be any different from “broadly integrated”. If it’s not useful, don’t do it.
What observations can we make from this scatter plot?
The first obvious thing is that there is some correlation between size and integration. Or more specifically, there are no small partially or broadly integrated agencies. That makes obvious sense – to offer more services, you need more team members, so all integrated agencies are larger than small.
But it doesn’t seem to be a strong direct correlation. Some large agencies are specialist. And this gives me an opportunity firstly to note a common mistake made with two-dimensional scatter plots like this, and then to use the outlier group to illustrate Porter’s Five Forces a bit more.
Unless some surprising correlation is the point you’re trying to make, you typically don’t want strong correlation in a competitor map like this. If there are only two dimensions AND they have a strong correlation AND that correlation is unsurprising, the scatter plot will tell you very little. Here’s a classic example to illustrate my point:

A correlation of quality with price is standard and unsurprising. Because of the strong correlation, knowing one variable about a competitor (they’re expensive) already tells you the other (they’re good quality) without requiring any chart. The only time a two-dimensional scatter plot with high correlation is useful is if the correlation is unexpected or if there are one or more outliers which buck the trend. The common theme there is: the results demand an explanation.
What we have here is a weak correlation (there is a general diagonal trend), with an outlier group in the top left. I think both demand an explanation, but I’ll focus on the outliers.

Being integrated demands some increase in size, but being larger does not necessarily demand integration – though it apparently tends that way. And because we noted in the previous article the different strengths and weaknesses of both size and specialisation, the different combinations of forces direct how different agencies are most likely to compete.
Before we read any more into this scatter plot, let’s remember that who constitutes competition depends on which agency’s point of view we’re taking. If we took the view of a single specialist, we could eliminate all of the agencies who do not offer that service, removing most of the other specialists, some of the partially integrated agencies and maybe a few of the broadly integrated ones, depending on the specialisation being considered. (In real life, those agencies end up cooperating with each other rather than competing. To some degree.)
On the other hand, if we took the view of a broad generalist, we might find that most of the agencies remain on the chart – most of the specialists, all of the partials and broads.
(For reasons I’ll explain in a later article, I would go a step further and keep in agencies who are not currently direct competitors, but whose services are directly adjacent to ours in whole marketing value chain. And mark them as such.)
The third dimension we talked about was a discrete binary distinction – local/independent versus multinational/networked. Rather than trying to add some third axis to the chart, we can do this with simple colour-coding:
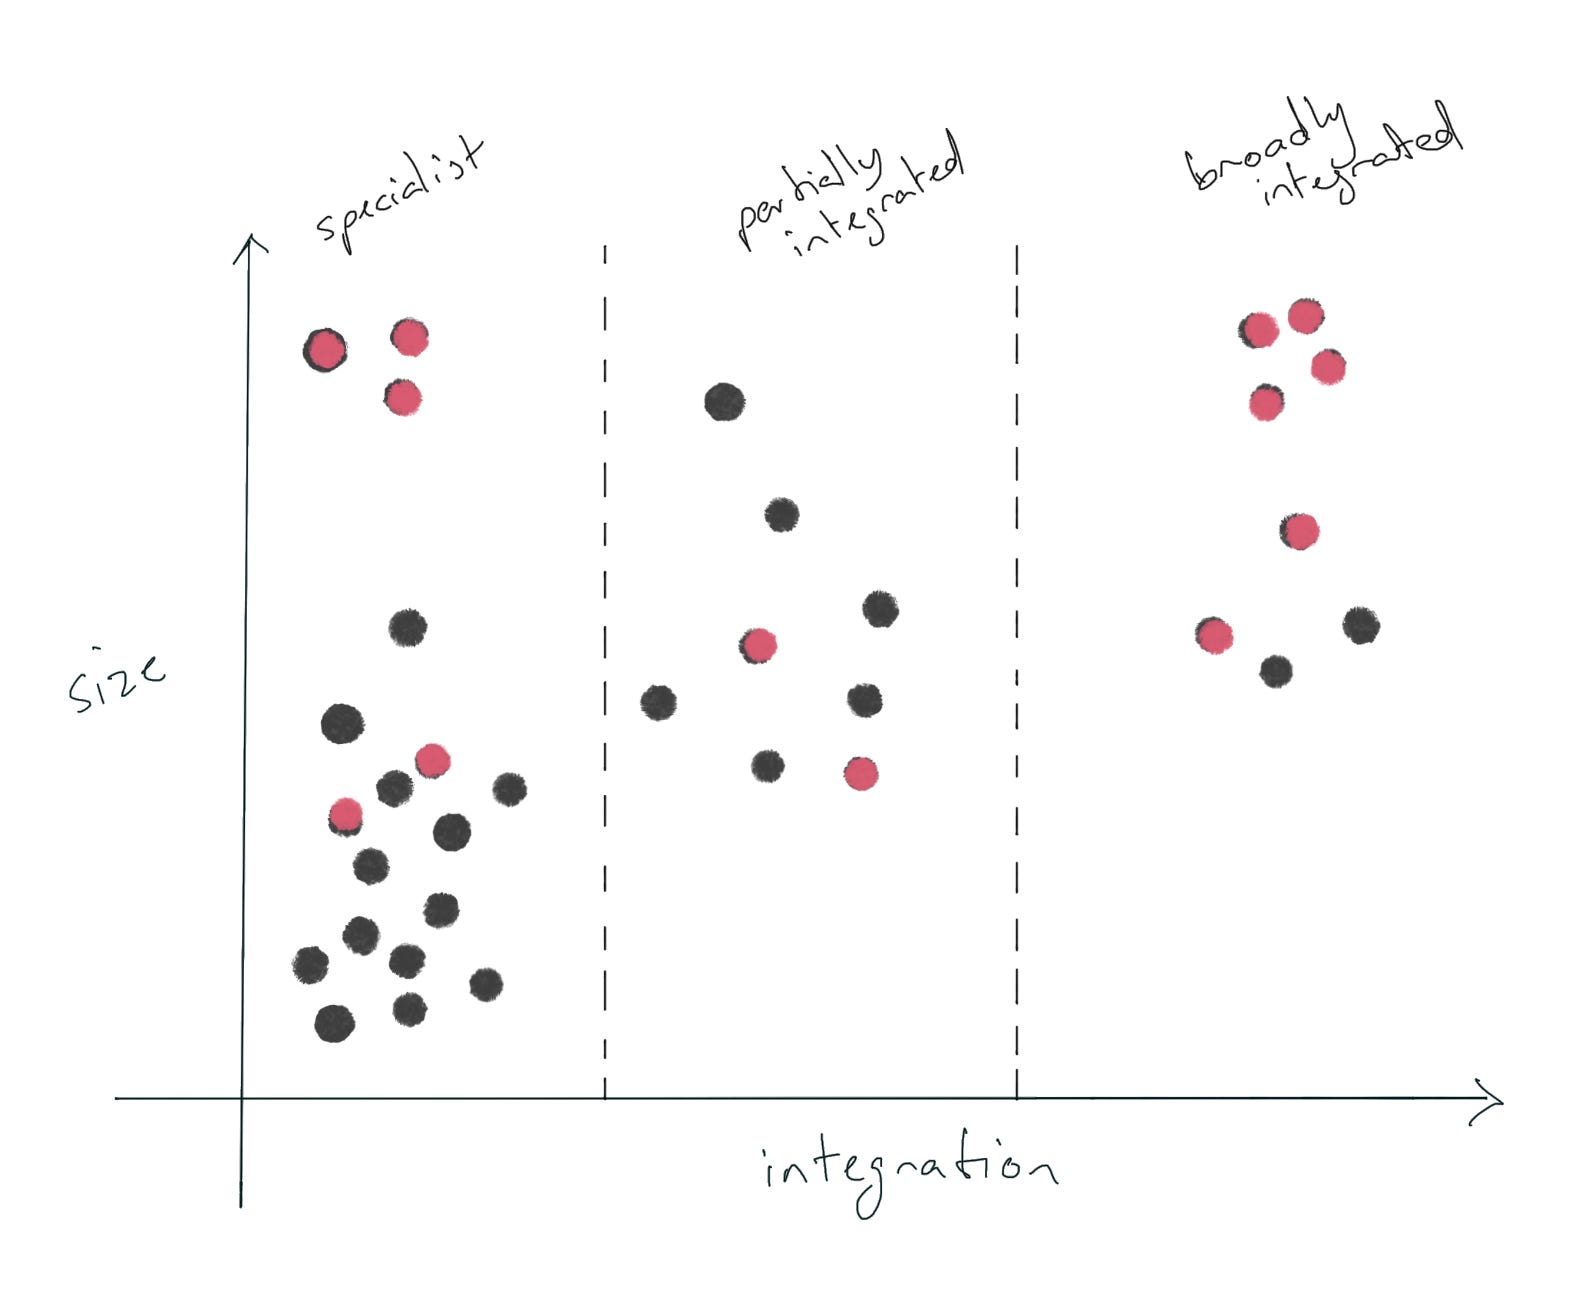
Clumsy, but you get the point. Perhaps unsurprisingly, most of the independents are specialist or partially integrated, and most of the broadly integrated are networked. And all of the outlier large specialists are networked.
We can see that there’s some clustering:
Lots of small to medium specialists, mostly independent
A few large networked specialists (the outliers)
Some medium partially integrated
And some medium-large broadly integrated.
Let’s start by taking a closer look at our outliers. In most markets, you’ll find that these are media (planning and buying) agencies. To explain this, we can go back to the Five Forces of Agencyland as well as the last article’s observations about the advantages of size.
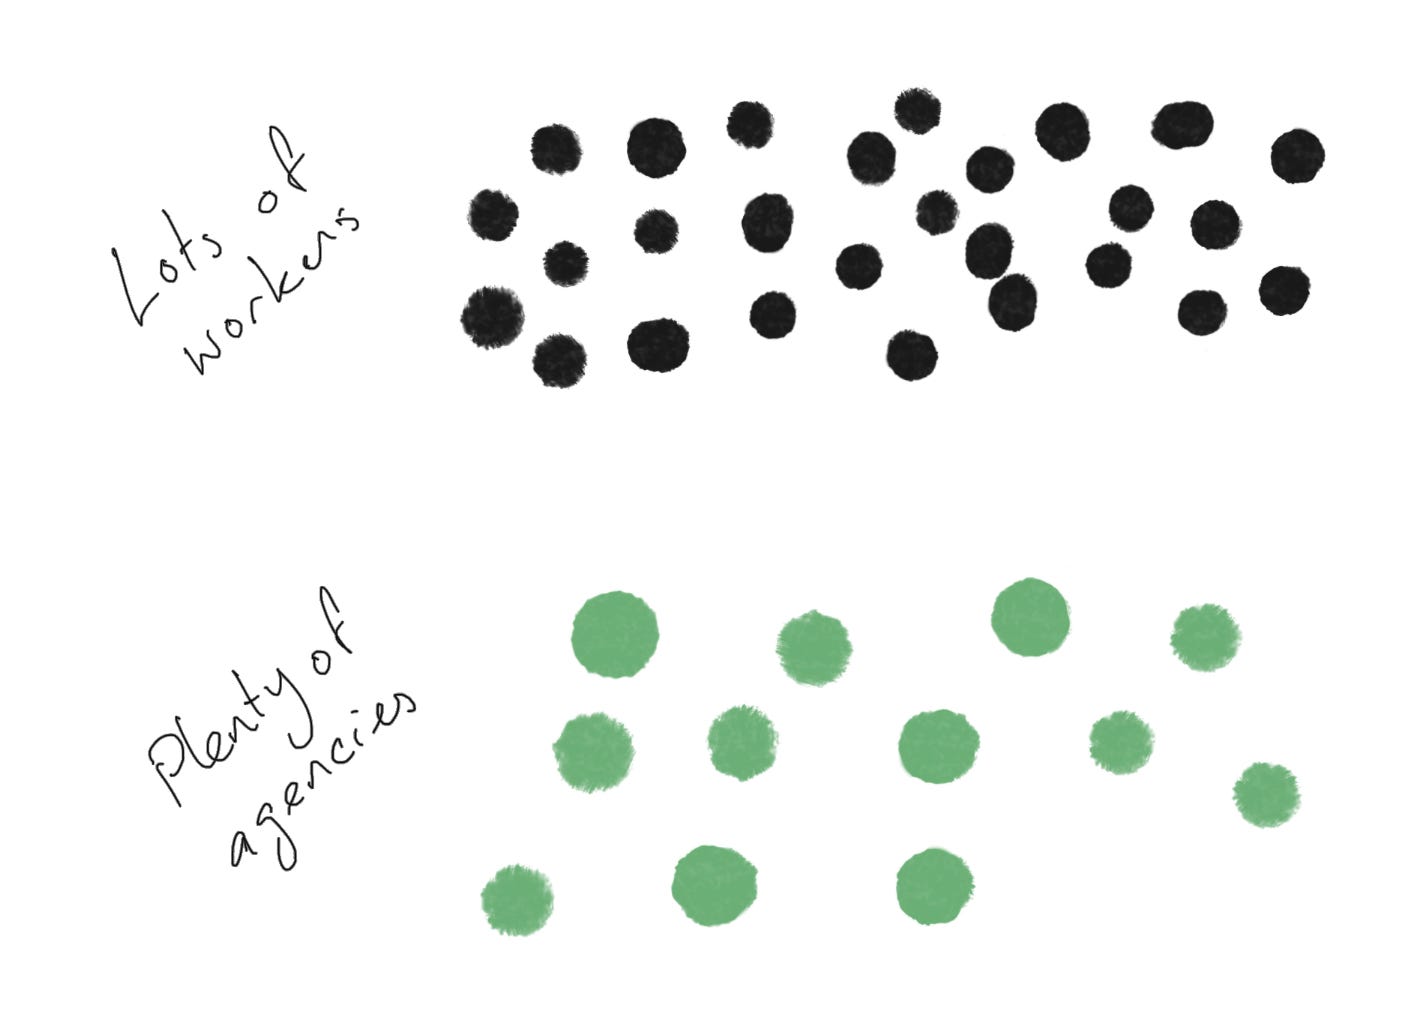
Compared to most agency types, the forces affecting media agencies are different. Firstly, unlike other agencies, media agencies’ largest supplier is not labour – it’s media owners, like TV channels, Google, Facebook, billboard owners, magazines, newspapers, etc.
Secondly, because of this, unlike the core activities of other agencies, media buying has inherent economies of scale. Part of the business model of media agencies is the aggregation of media buying. Any given large media agency buys more media than any single client ever would. In doing so, they form relationships and negotiate bulk discounts, some of which they can pass on to their customers.
Thirdly, because of this, and unlike other agencies, there are barriers to entry into the industry of media agencies or the strategic group of media agencies, depending on how we’re defining our industry. The Five Forces framework can be applied to an industry, but it can also be applied to a strategic group within that industry – that is, a cluster of businesses competing in a similar way – if the facts of those businesses mean that the forces have a significantly different effect.
Remember that the “supplier power” force is often shaped by the relative concentration of buyers in the industry compared to suppliers to the industry. For agencies whose main input is labour, there are lots of agencies for workers to choose from, and that becomes more pronounced as you shift into more and more expert labour (e.g., highly experienced creative directors). But for media agencies, who are the overwhelmingly dominant purchasers of media, there are only a few of them relative to a broad range of media owners selling placements.
Immediately we can assume there’s upward pressure on the profitability of media agencies because of this. The media agencies don’t get together and agree to only pay lower prices for media (that would be collusion and illegal), but implicitly there are only a few other games in town for a media owner to sell space – and the media owner is in competition with a dizzying array of other options. Bargaining power for those few media agencies is high – and bargaining power for media owners is low.

Some hints here as well as to why the workers of some industries unionise.
So media agencies enjoy an advantage in profitability from the Supplier Power force. Why doesn’t the market just correct itself and other businesses or new businesses join the fun?
In this case, because of the volume of buying necessary to achieve economies of scale for media agencies, they are protected from those two kinds of competitors: new entrants and non-media agencies diversifying their offering to include media. In either case, the would-be competitor would either need to attain scale very quickly or have deep enough pockets to ride out the years it would take to grow to the necessary size.
Plenty of investors or businesses could do that. But the investment required is not justified by the size and horizon of returns. So they wouldn’t do that. And that’s an important thing to remember for competitive business strategy: when it comes to competitor behaviour, wouldn’t is as good as couldn’t.
And so the Five Forces – supplier power and threat of new entrants in particular – give media agencies an advantage which is not found in agency types whose main input is labour and who don’t enjoy the same economies of scale. It is left to the other forces to keep prices and profitability down. There is still some internal competition between them. There is still some threat of substitution with their customers doing their own buying. And there is still some buyer power among larger clients who can threaten to switch media agencies with relatively low switching costs.
So, given these differences, should we just remove media from our scatter plot and be left with a general trend of small/local/specialist to large/global/generalist? The curveball there is that there are some smaller and generalist agencies which compete with the large specialist media agencies for offering media services. While the economies of scale might not be there for them, they’ve made a strategic choice to add media to their mix for the synergies mentioned in the last article about integration.
That is, while they might not be able to bargain for the same sized discounts from media owners (cost leadership), they can make the case to prospective clients that including both creative and media planning services in a single team allows them to improve the overall value to clients (differentiation). If the size of that added value outweighs the relative challenge to profitability of media services alone, they can demand a premium or at least win more business for the same price.
And that is as good a segue as any to talk next about the four (five?) generic strategies for profitability.
Yes, I know that “data” is technically a plural.