
Better Odds: Narrowing the Scope
What pointier questions actually do to creativity.

So, the story so far:
Let’s describe a simplified hypothetical situation. Imagine there is some challenge we want ideas for. It doesn’t actually matter if this is about ideas for a product/service innovation, a cost-cutting initiative, a marketing campaign, a line of copy for social media, etc. There is a challenge with an objective, and there are multiple possible actions we could take (ideas) to achieve it. We want to uncover the best idea we can have in the time available to have ideas.
But for our thought experiment, let’s make it a creative communications challenge. We want to drive demand for our new houseplant spray. It’s a combination spray that includes insecticide, fungicide and fertiliser. It’s new – no one has made this product before.
And for the purposes of our thought experiment, let’s say that there are only three factors that contribute to how much someone would want this spray. They are:
It takes up less space in the cupboard to have just one product instead of several (storage space).
It offers peace of mine for customers who neglect something (insects, mould, nutrition) when taking care of their houseplants (reassurance).
It’s less expensive than buying two or three separate products (price).
When I say there are only these three factors, I mean that any idea that drives demand for this product will need to address one of these to be successful. So obviously it’s a very simplified hypothetical situation. Typically there could be dozens or more in total. Technically there are infinite possible factors. I’m exaggerating for illustrative purposes.
Let’s say we brief a creative team to come up with ideas for campaigns to drive demand for this new product, but we give them no further direction than that. They come up with, say, 60 ideas. We don’t know it yet, but some are better than others. Again, we don’t know it yet, but the distribution of the quality of those ideas looks familiar:
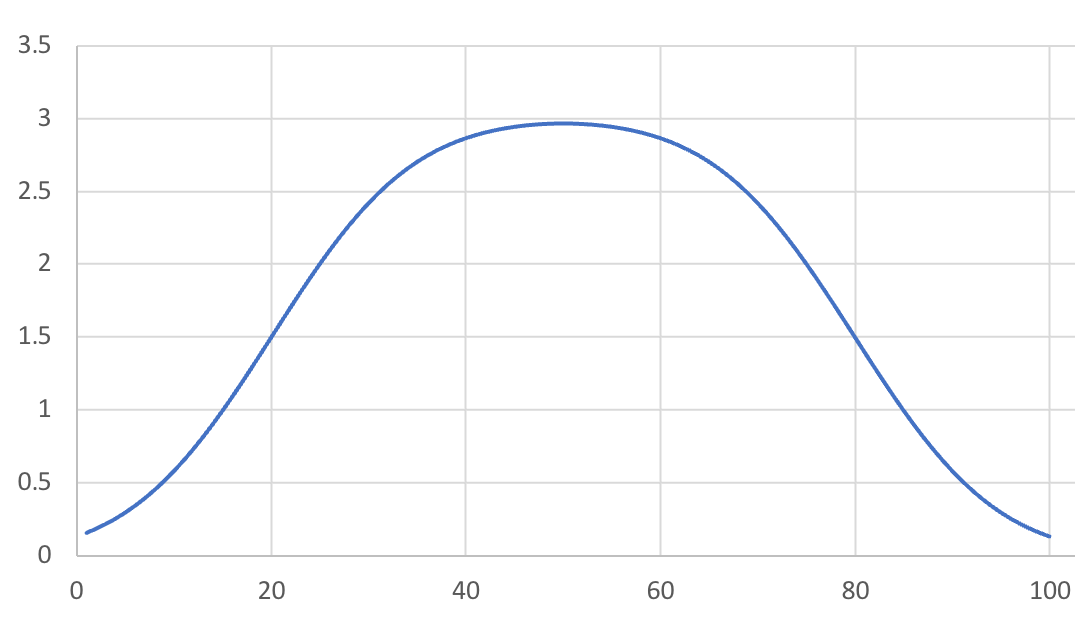
Among these 60 ideas, about 20 ideas emphasise price, 20 emphasise storage space, 20 emphasise reassurance.
We don’t have a lot to go on in evaluating the ideas. The creative director knows that some are better creatively than others – that is, in her experienced judgement, some are going to get more attention, some will get a good laugh, some really stand out from the competition, etc.
The CD doesn’t have anything more than an experienced eye to go on for predicting the success of the ideas in terms of their objective, even though they will in fact vary in their effectiveness if put to market. But the team knows that creative quality is some indicator of effectiveness, and so the best three ideas are chosen by this measure. They’re put in front of the client and one is chosen to go to market.
Now, let’s rewind a bit. These three factors are not all equally compelling. Whether we know it or not, the most compelling of the three is the peace of mind the product offers, because houseplant owners really kick themselves about forgetting about mould or forgetting to fertilise, etc. (I’m making this up.) Price is less compelling for our audience. And finally, not many potential customers particularly care about their shelf space.
Our creative team came up with 60 ideas, coincidentally an equal number of 20 ideas that addressed each of our three possible motivating factors. And among each of those groups of 20, there was some variety in idea quality. So if we distinguish those ideas on our model, we get three smaller bell curves.
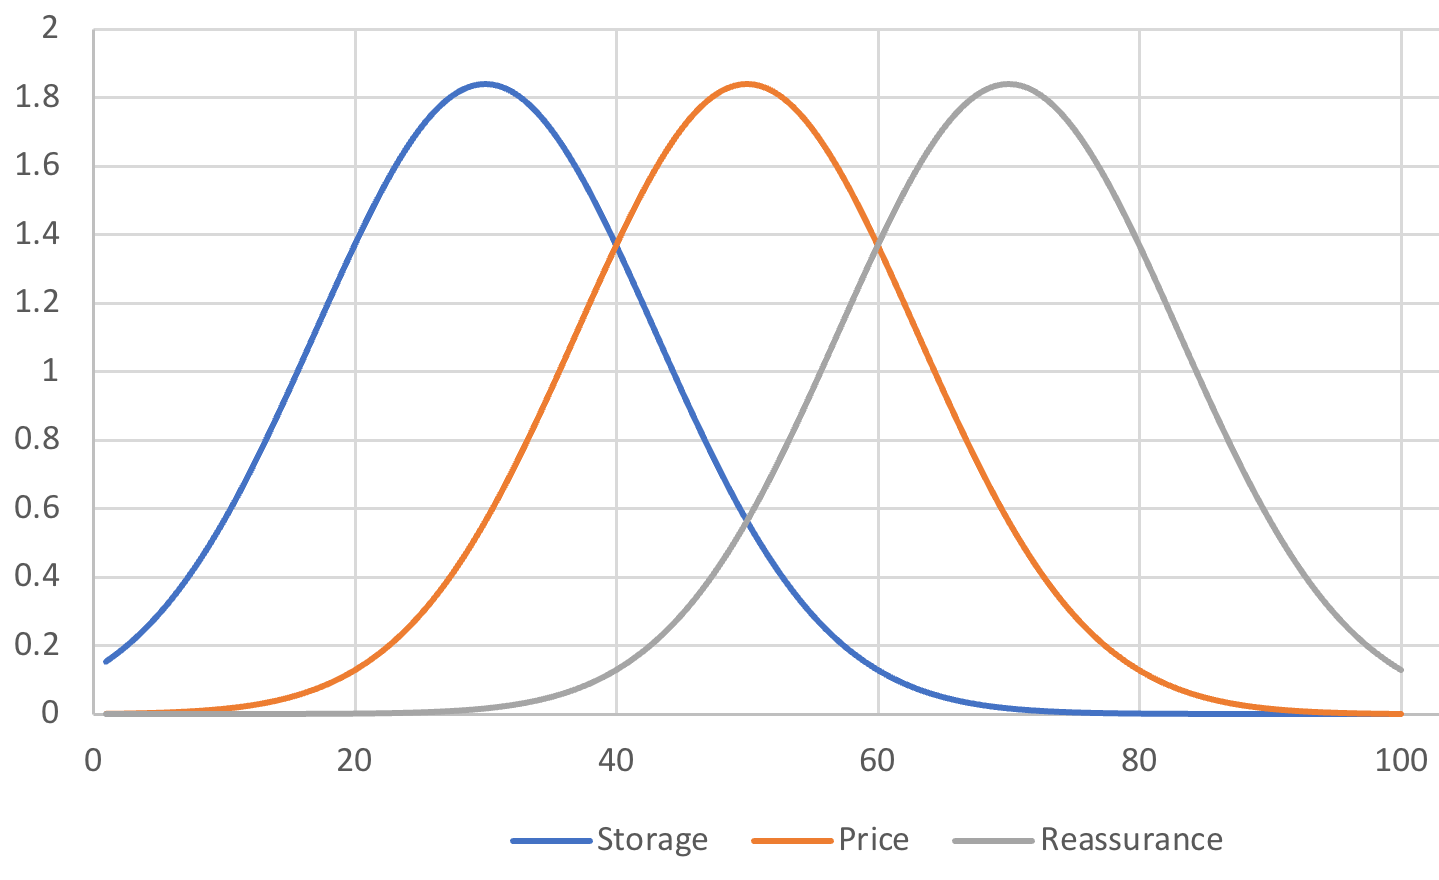
A few things to note here. And keep in mind that by “quality” we here mean the end results of these ideas going to market, in terms of driving demand for the new product, and assuming that all ideas would be equally well executed.
One point is that the average ideas based on communicating reassurance (the peak on the right) are of higher quality than pretty much every idea based on storage (the blue curve on the left). And depending on our standard for a good-enough idea, none of the storage ideas are good enough, maybe a few of the price ideas are good enough, and the majority of good-enough ideas are based on reassurance.
Another point is that all three of the curves overlap. That means that really great ideas based on the least influential factor (storage space) are better than most of the ideas based on price and better than some of the worst ideas based on the most influential factor (reassurance).
And finally, it’s clear that there’s not really such a thing as an objectively average idea. What’s average for one group of ideas is terrible for another group of ideas. This is really the reason I can use “average” and “obvious” almost interchangeably. The most ideas are obvious ideas are most ideas are average ideas. Within any given group of ideas.
And I’m just going to say again that by “quality” here I do not mean what we might think of as creative quality, like “wow, what a cool idea”. I’m talking about effectiveness in terms of outcomes. Cool creative ideas addressing the wrong issues can be relatively ineffective. Run-of-the-mill ideas addressing the right issues can be relatively effective. Obviously in marketing you want both, but that’s not necessarily the case in a lot of other strategic/creative contexts.
In creative marketing, there’s a real danger here. If ideas are chosen purely on “how good an idea” they are from a creative perspective, and the cool creativeness of an idea correlates with its position on the right-hand side of an individual curve, then it’s very believable that you’ll pick an overall relatively ineffective idea as best – and take it to market. It was a great idea, but it addressed the wrong issue.
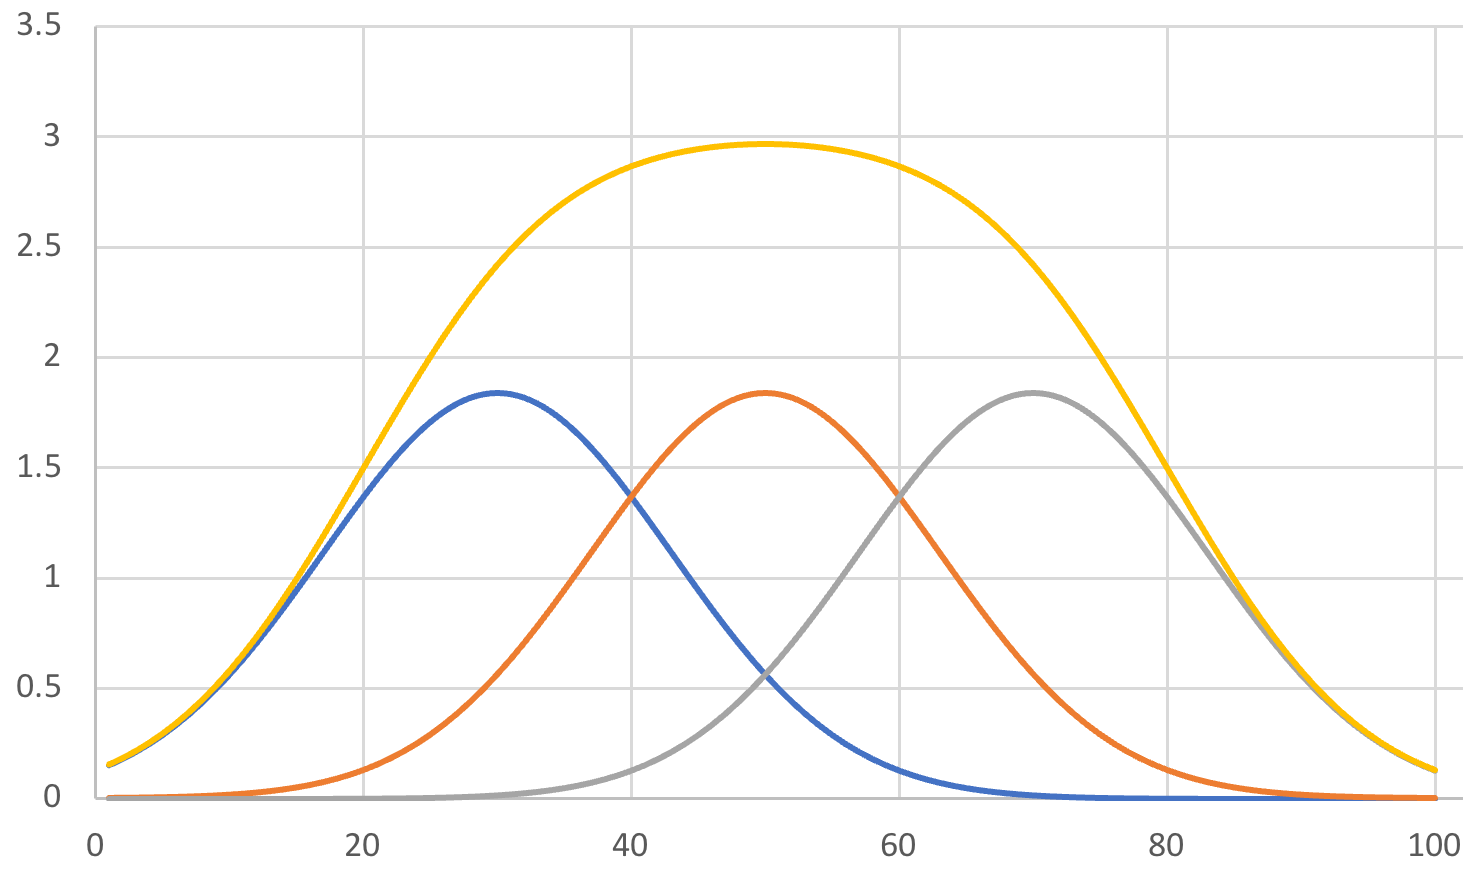
Now, those three overlapping quality curves of the three different groups of ideas, when combined, give us the quality curve of the whole collection of ideas that the creative team came up with with their broad undirected “come up with ideas to increase demand” brief.
So let’s imagine a different hypothetical.
The client comes to the agency and says, “Hey, grow demand for our new product.”
This time, the strategist takes that client brief and does some research. He looks at the competitors’ products, features and prices. He interviews or focus-groups some potential customers. He designs and delivers a survey to a representative sample of potential customers. (It’s my hypothetical, so there’s budget for research if I say so.)
And the strategist concludes that out of all the possible factors to highlight (simplified from infinity to three, for our purposes here), “reassurance that you haven’t forgotten about pests, mould or fertiliser” is the most compelling reason to be interested in buying this new product. The creative team are given a tighter creative brief, specifically about promising that reassurance.
What happens to our idea quality curve? Is it that grey curve on the right of the graph above? Nope, even better. That curve only represents the 20 ideas out of the 60 which happened to speak to that more influential issue. Because the creative team are now briefed only on that tighter direction, they don’t waste any time on the other two directions and all 60 of their ideas are inside that right-hand curve.
So the difference looks like this:
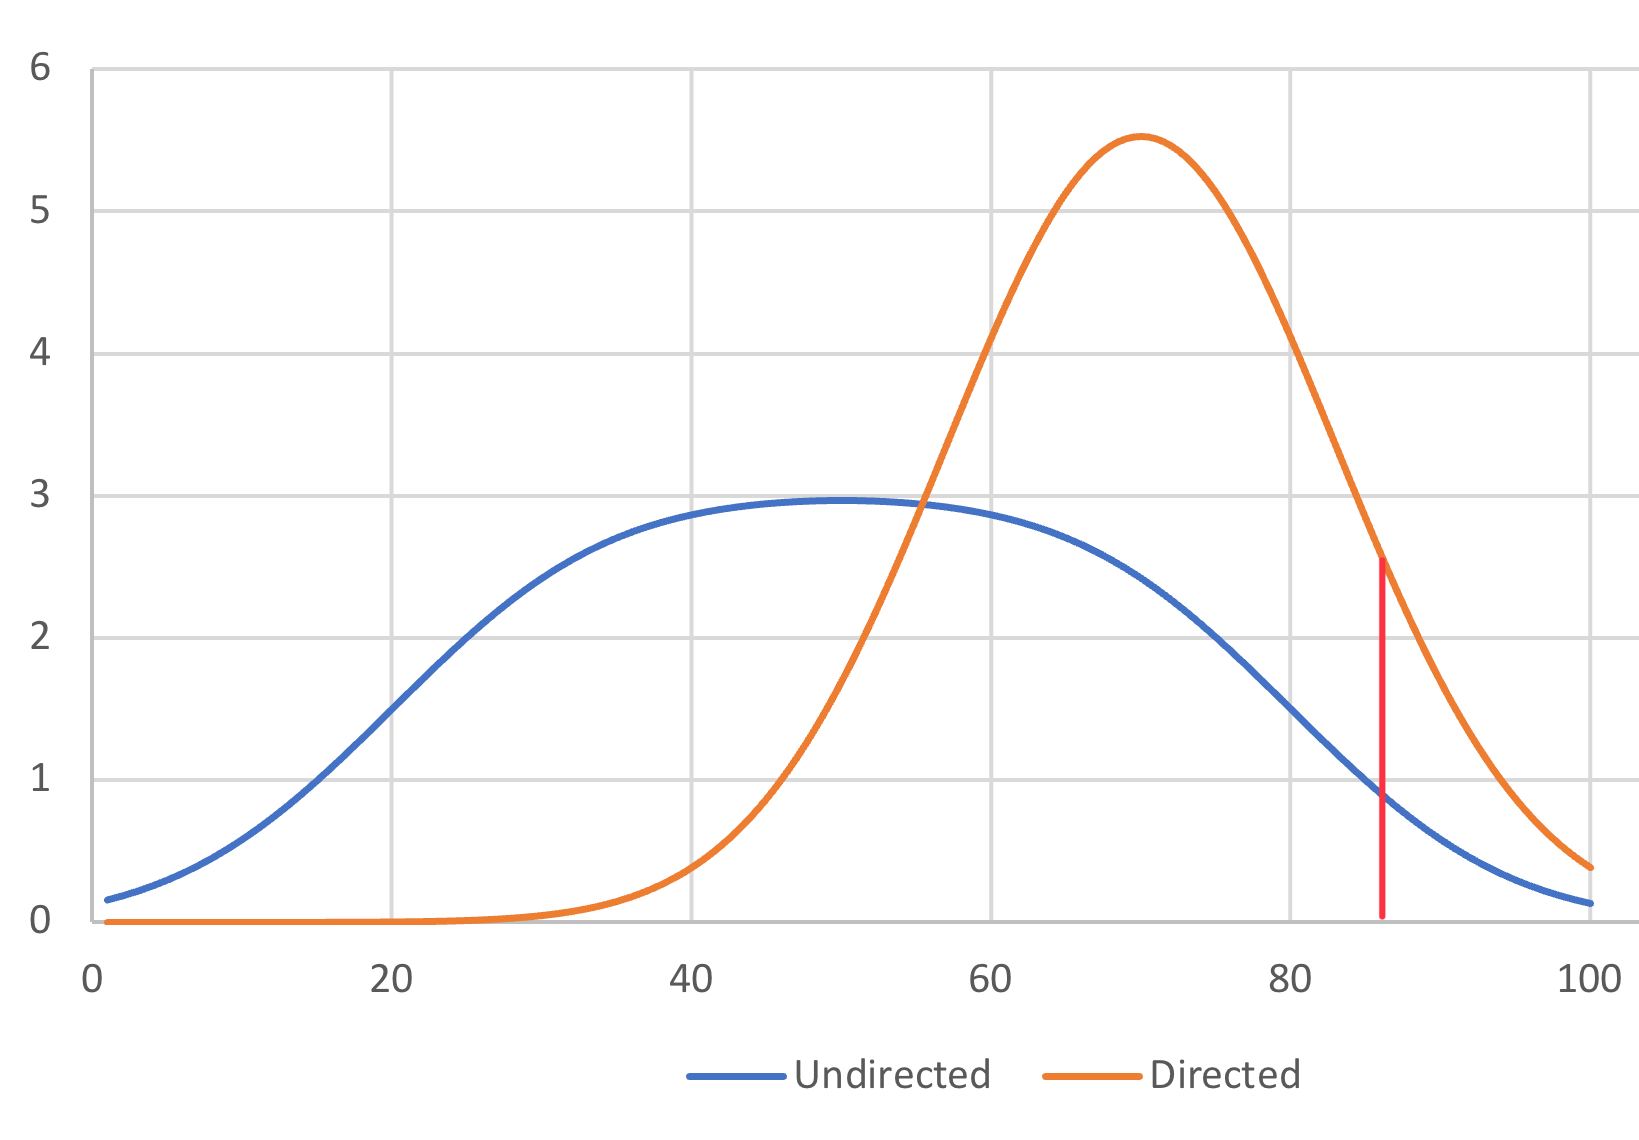
What do we see happening?
It’s the same number of ideas (same area under both curves).
The average quality of the directed ideas is higher than the average quality of the undirected ideas.
(Because the obvious ideas for the directed brief are more effective than the obvious ideas for the undirected brief.)
There are more ideas to the right of the red line (more good enough).
There are more outliers are the far edge – more potential for great ideas.
Note that there were still some good-enough ideas in the undirected ideation. But all other things being equal, you could have about 2.5 times as many good-enough ideas in the same amount of time OR you could have the same number of good-enough ideas in 40% of the time.
Well… it doesn’t quite work like that. It might be a stretch to say that a good brief cuts the required creative time down by 60%. But certainly you can achieve the same result in less time or increase your odds of great ideas in the same time.
It’s still odds, people. It’s still probability. These curves are just meant to represent those odds and illustrate the effects of strategy on creativity. You can have a pointier question with no great ideas. You can have great ideas off a broad undirected question.
People can win Lotto. People can lose betting on a full house.
Agencies with shitty processes can have great ideas. But teams with good strategic and creative processes have more in the long term, and even their average ideas are relatively effective.
What’s next? Oh yeah. Diversity. Or how good individuals are at coming up with ideas. Or the effect of more interesting questions. I’ll pick one of those.